The Series So Far
Paper I established the phenomenon: coherent dynamics on the 600-cell that are absent in control graphs. Paper II identified the structure: seven algebraic invariants governing the nine-sector spectrum. Paper III classified the taxonomy: four attractor classes with a non-generic distribution.
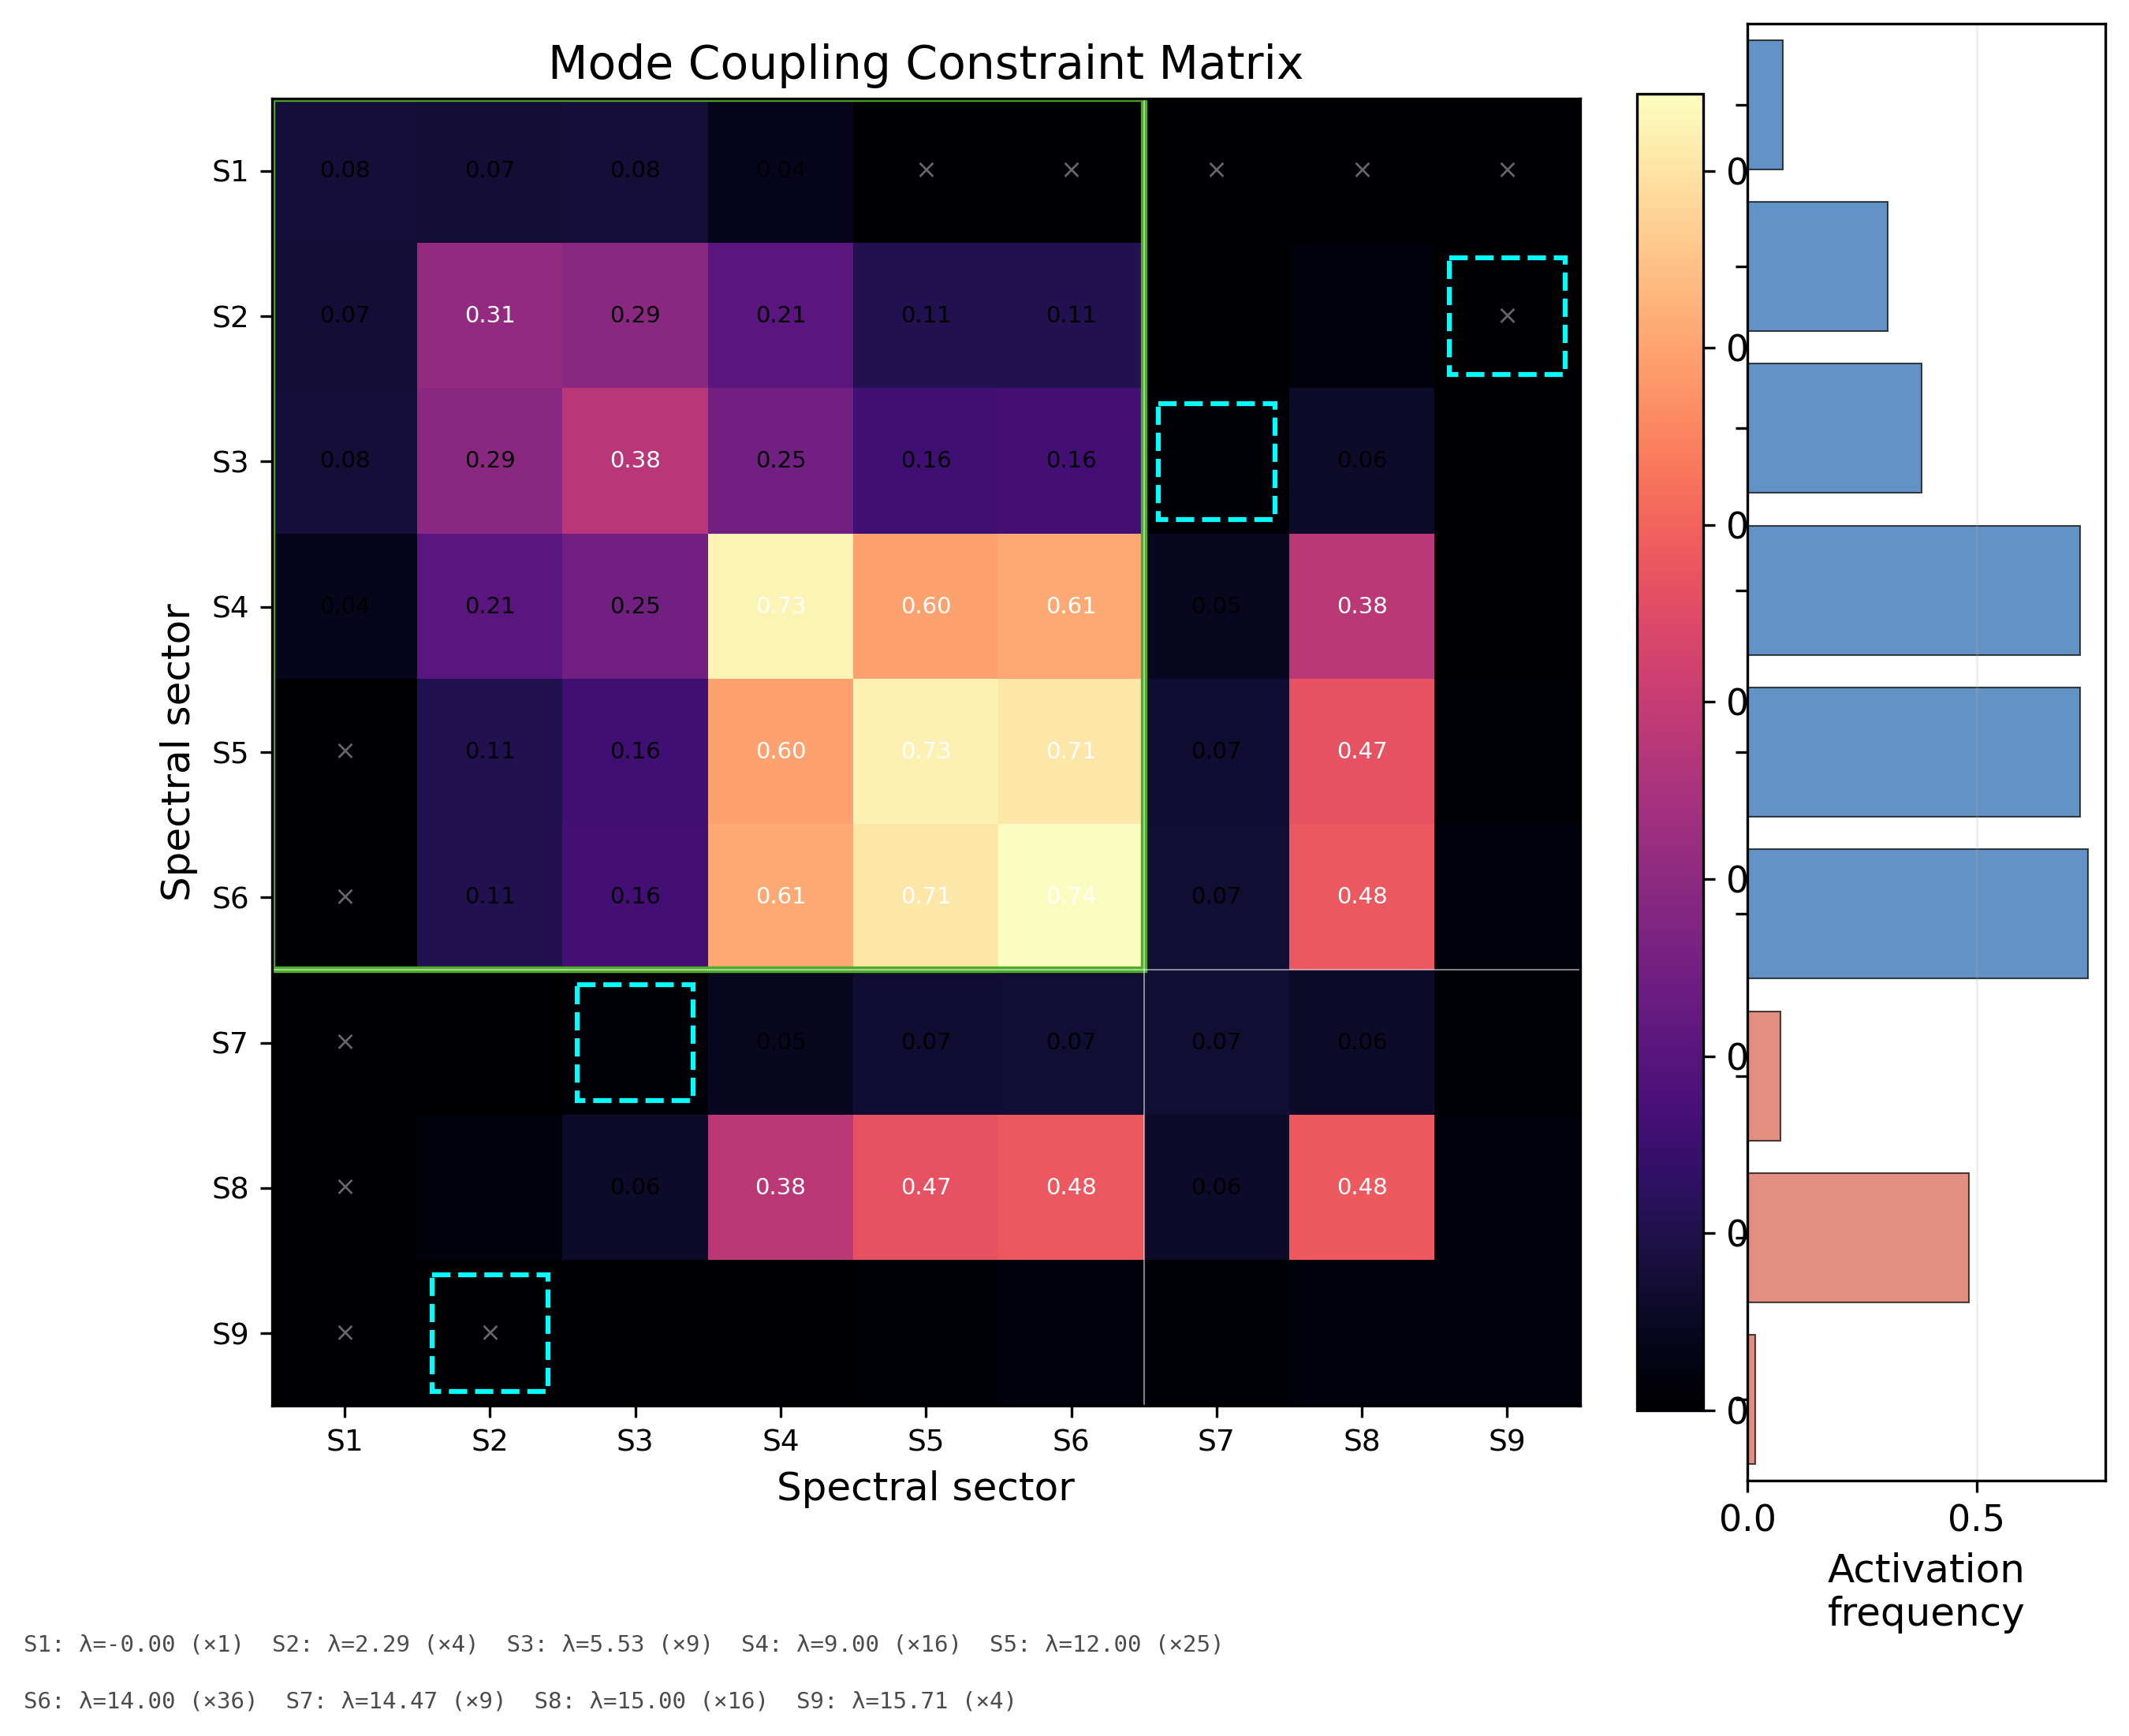
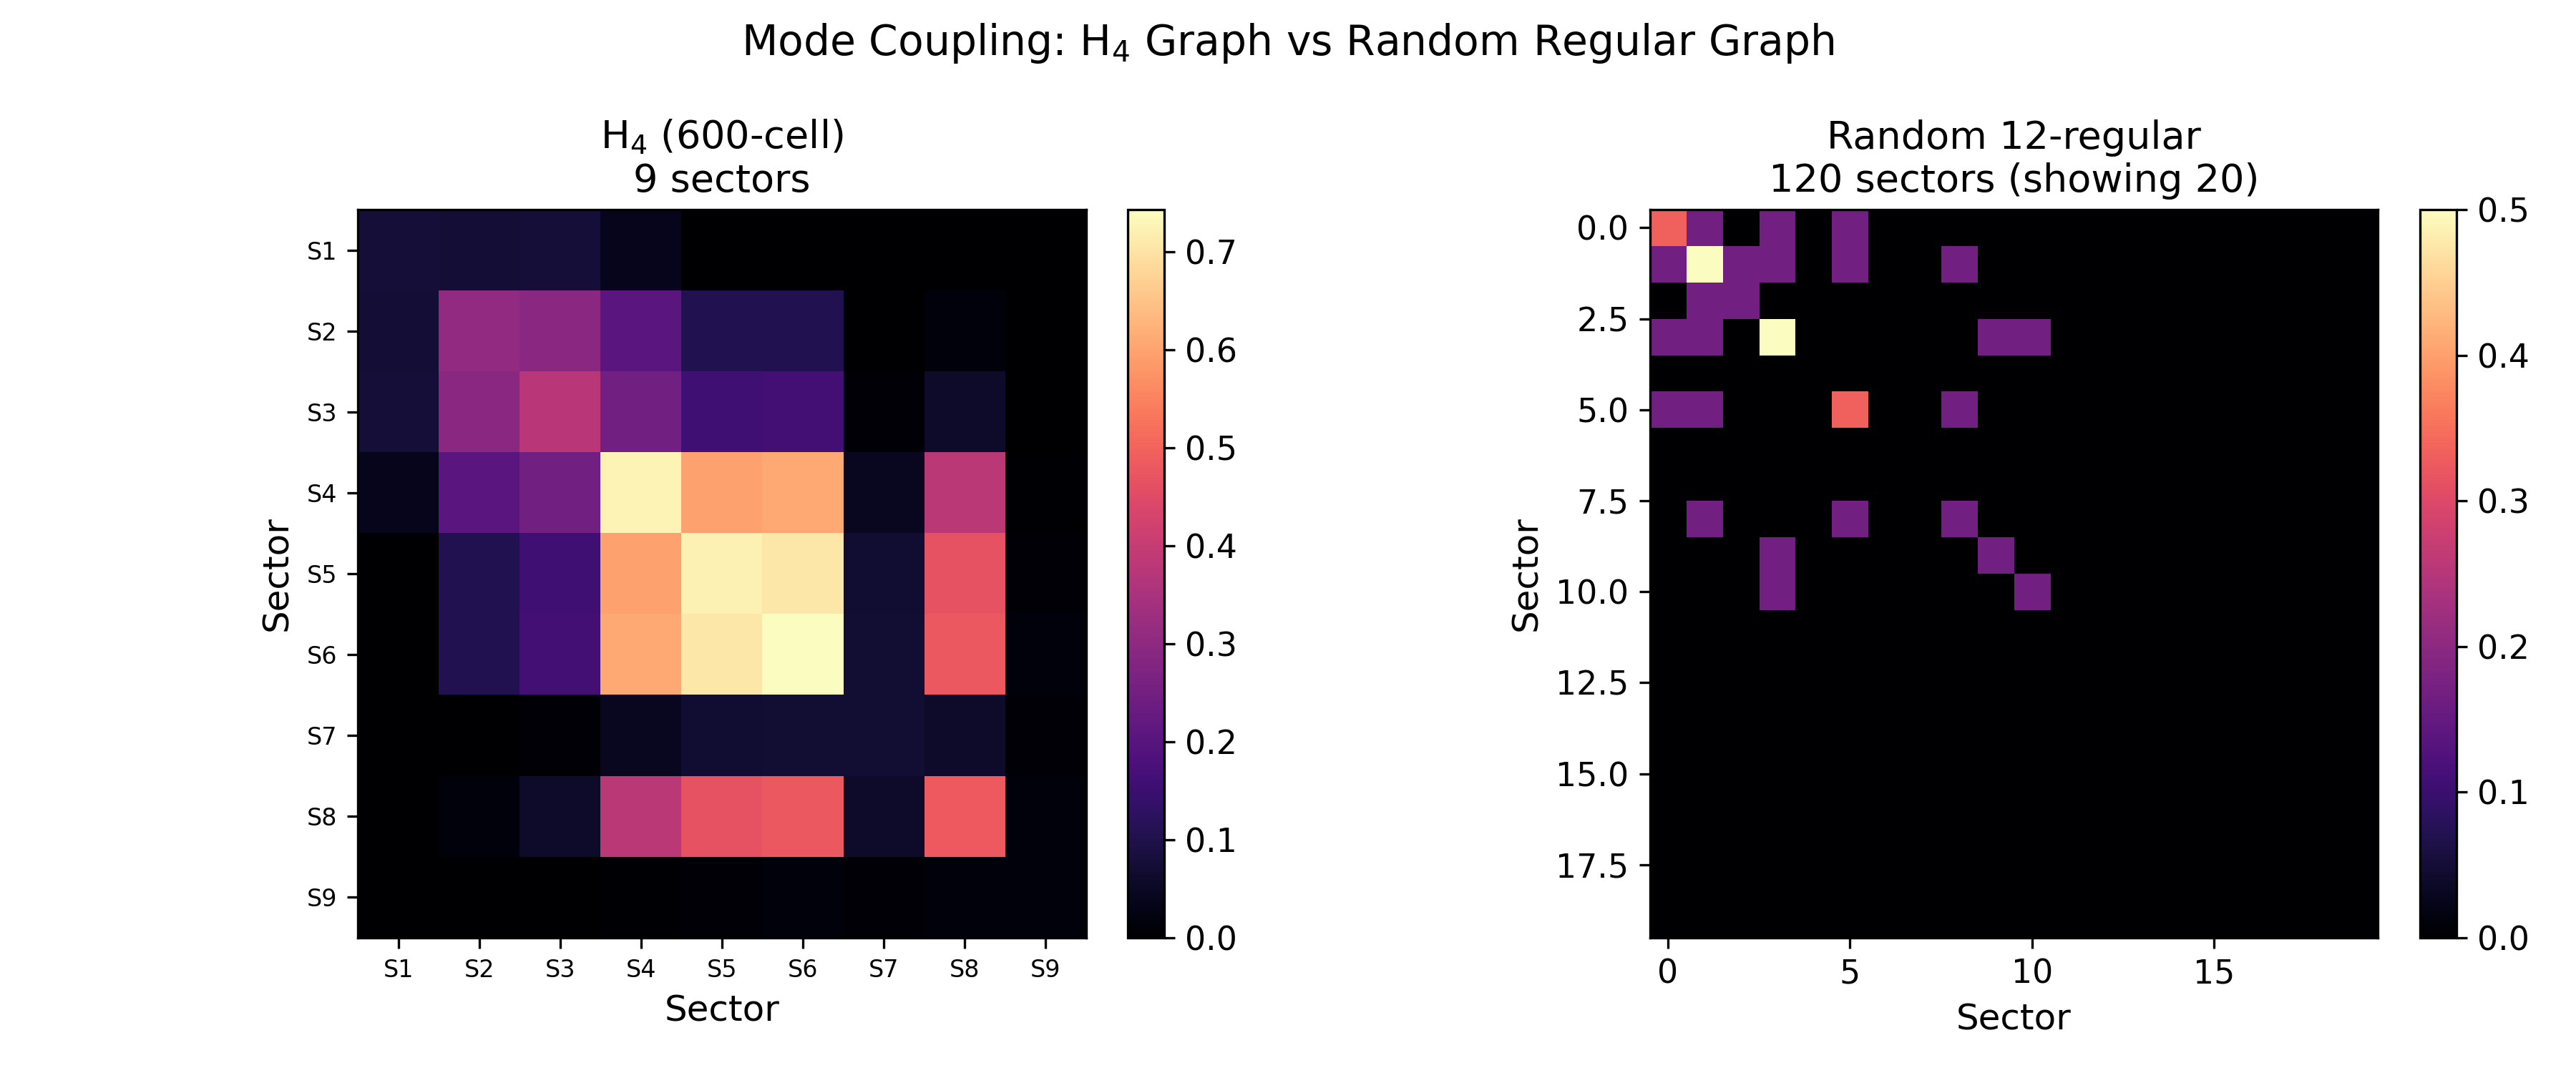
The Mode-Coupling Constraint Matrix
The central result is an empirical mode-coupling matrix constructed from 1,165 stable attractors across 1,200 simulated trajectories. For each stable configuration, the paper records which of the nine spectral sectors are active (carrying >10% of the mode energy) and which co-occur.
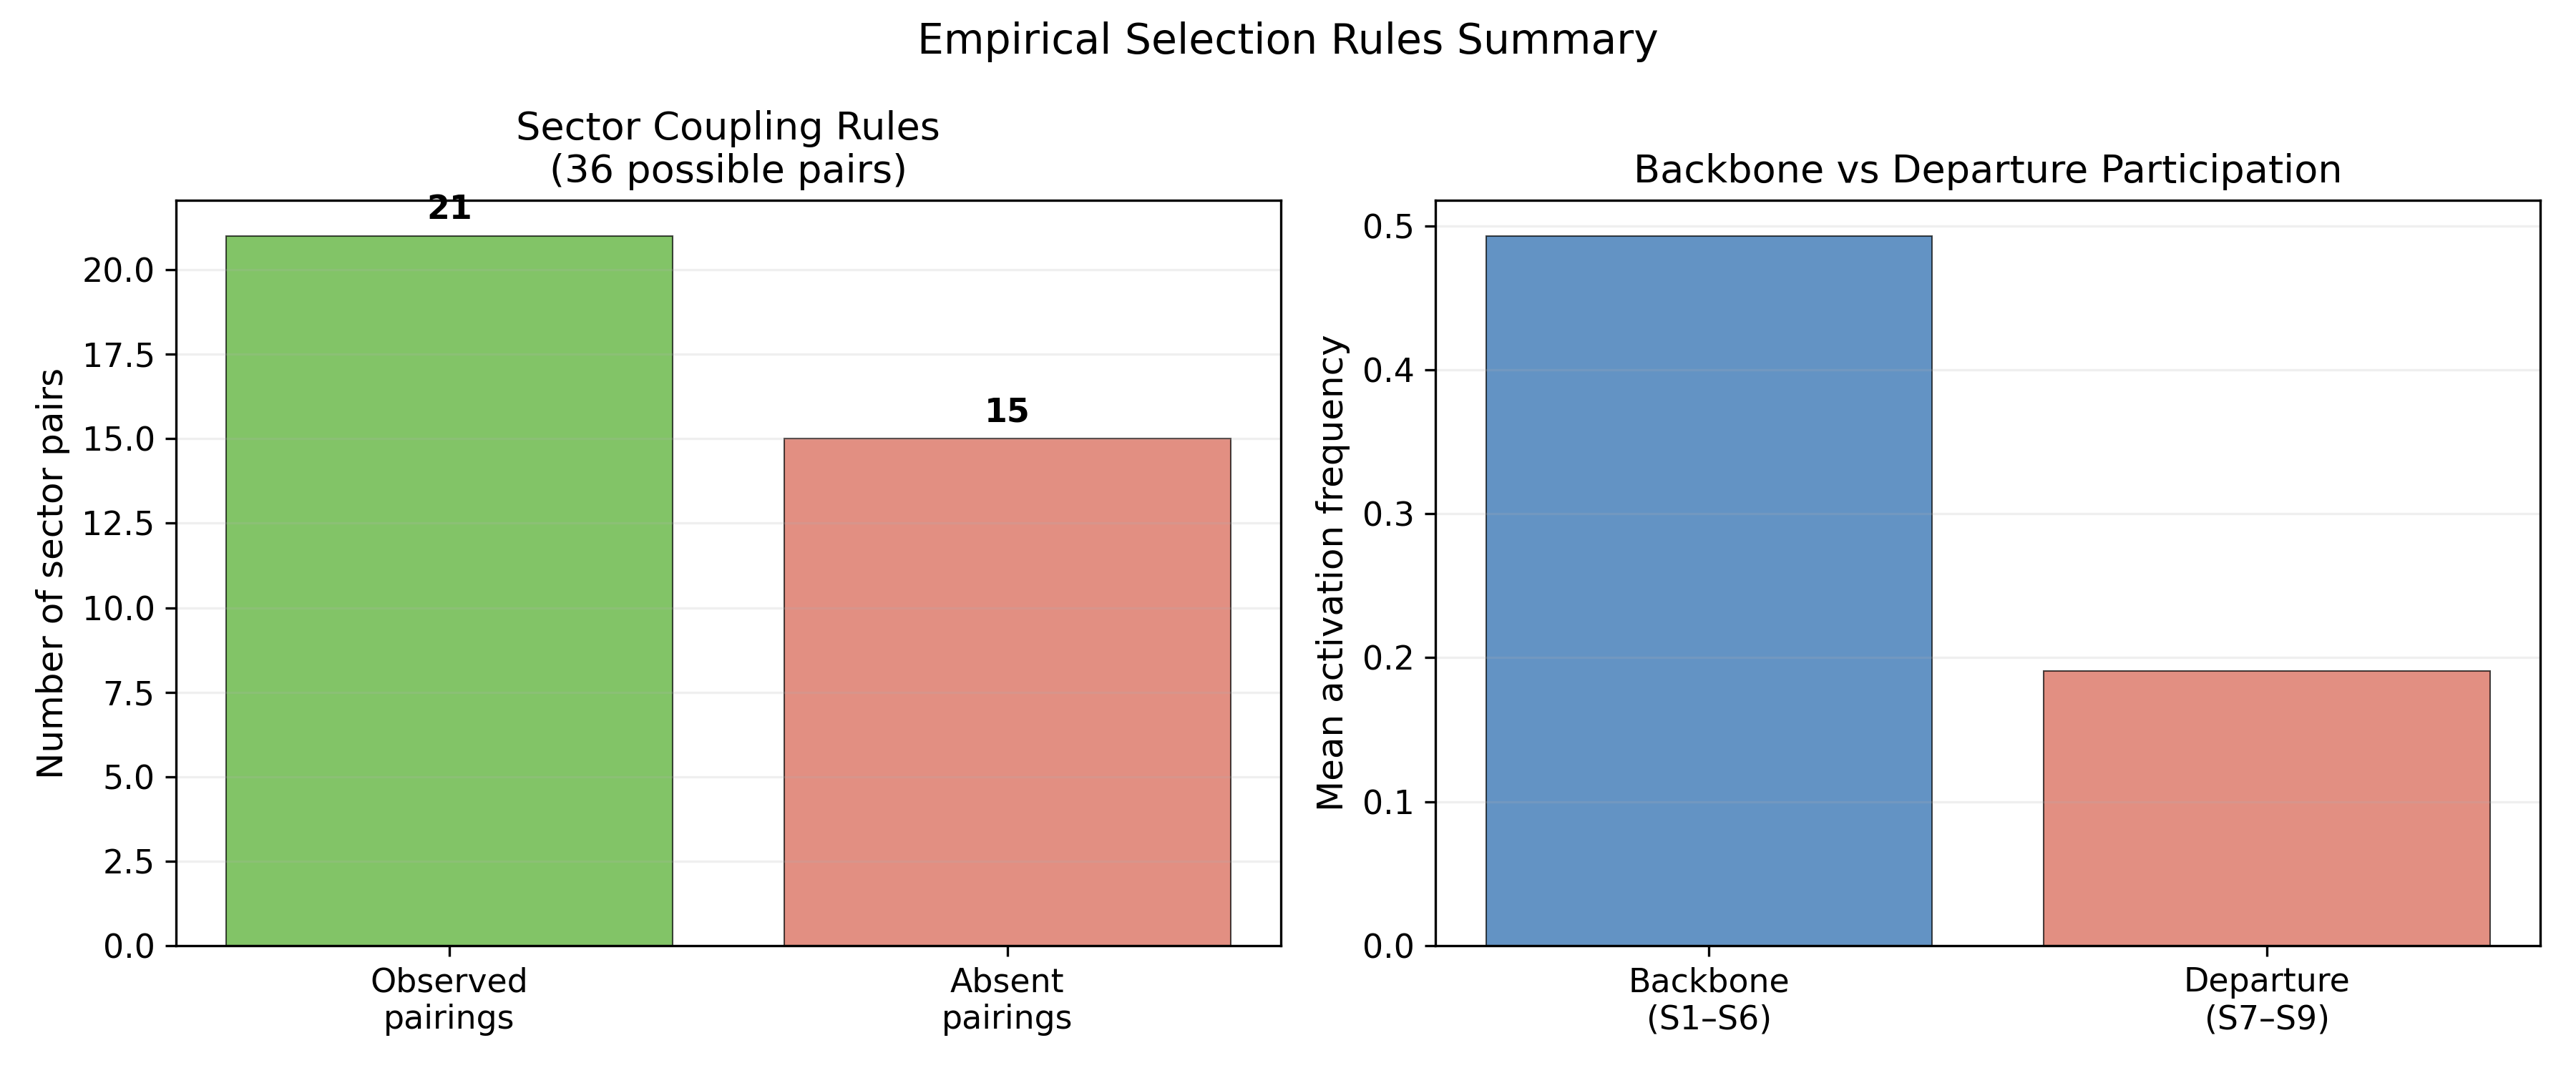
Of 36 possible off-diagonal sector pairings, only 21 are observed in stable attractors. The remaining 15 are absent — not because they weren't sampled, but because the spectral organisation of the H₄ graph prevents those combinations from forming persistent configurations.
Six Empirical Constraints
The coupling analysis reveals six reproducible constraints governing the attractor space:
Mode selectivity. Stable attractors are not formed from arbitrary combinations of eigenmodes. Only a restricted subset of sector pairings occurs with appreciable frequency.
Backbone dominance. The spectral backbone (sectors S1–S6, comprising 91 of 120 modes) accounts for the dominant share of attractor composition. Backbone sectors activate at 2.6× the rate of departure sectors.
Localisation threshold. Spatially localised breather-like attractors emerge above a nonlinearity threshold (β ≳ 0.1) and concentrate energy in the inner distance shells of the graph.
Stability–composition correlation. Attractor persistence correlates with spectral composition: backbone-dominated configurations are more temporally stable than those involving departure sectors.
Attractor finiteness. The number of distinct attractor families is small relative to the combinatorial space of possible sector combinations.
Symmetry-related sets. Attractors related by the H₄ symmetry group occur as equivalent sets under vertex permutation. The coupling matrix inherits the conjugate pairing structure of the spectrum.
Where Energy Lives
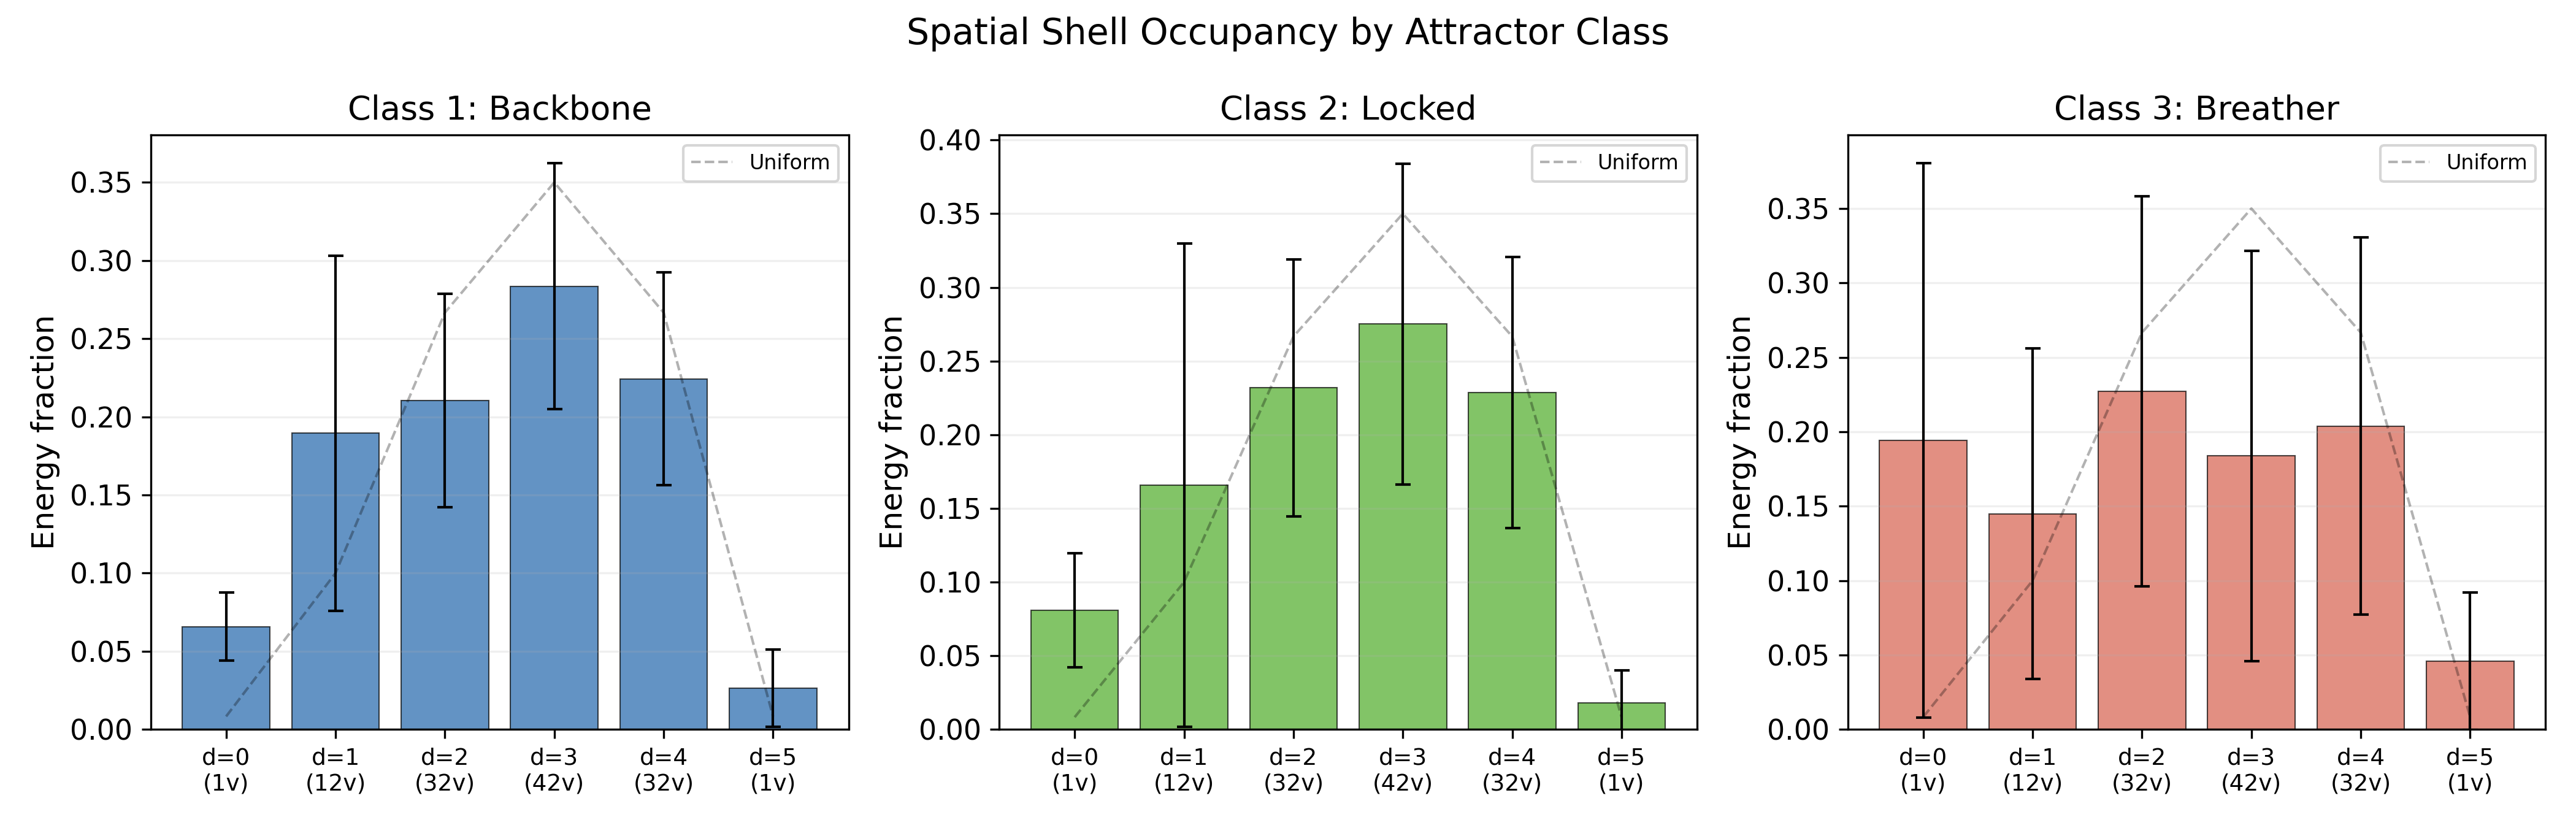
The 600-cell graph has palindromic distance shells: (1, 12, 32, 42, 32, 1). Paper IV shows that the spatial distribution of energy within attractors is not uniform but reflects this geometry.
Localised breather states concentrate 34% of their energy on just 13 vertices (the centroid and its 12 neighbours) — 11% of the graph carrying a third of the energy. Backbone harmonic states distribute energy more uniformly across the middle shells.
A Stability Hierarchy
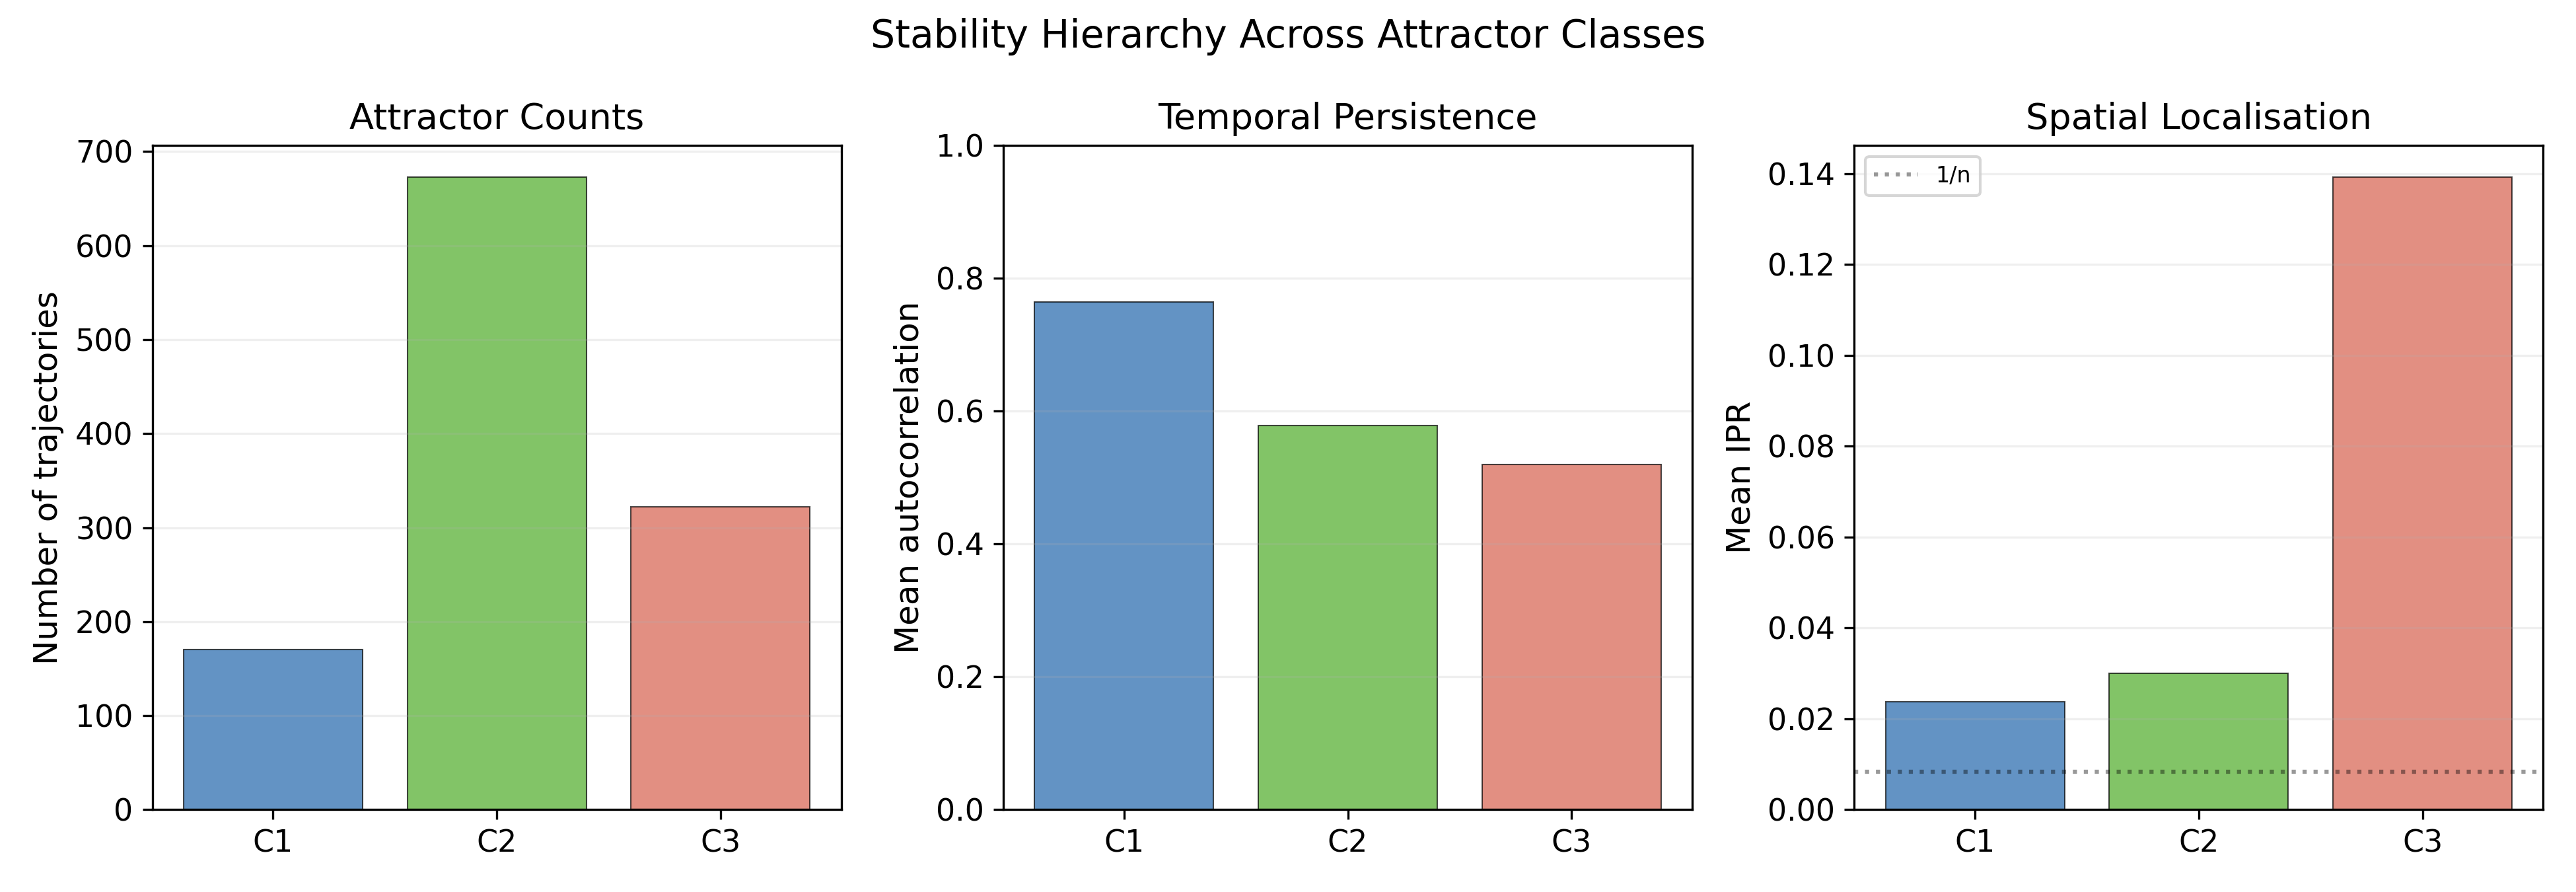
Not all attractor classes are equally stable. The paper identifies a clear hierarchy:
- Class 1 (backbone harmonic) — highest temporal persistence (Cmax = 0.764), lowest localisation. 96.7% backbone spectral energy.
- Class 2 (locked multi-mode) — intermediate persistence (Cmax = 0.578). Most prevalent class across all β.
- Class 3 (breather) — lower persistence (Cmax = 0.520) but 6× stronger spatial localisation. A trade-off between temporal persistence and spatial concentration.
Controlled Comparison
The same analysis pipeline applied to degree-matched control graphs (random 12-regular and degree-preserving rewired 600-cell) produces dramatically different results:
- Control graphs produce ~5 stable attractors per graph vs 1,165 on the 600-cell
- No coherent coupling structure emerges
- Destroying the H₄ symmetry by rewiring eliminates the structured coupling pattern entirely
What This Does Not Claim
- That the selection rules are analytically derived — they are empirical observations from numerical simulation
- That every possible attractor has been sampled — the ensemble is finite (1,200 trajectories)
- That absent pairings are exactly forbidden — they may be suppressed below the detection threshold
- Any direct mapping to physical particles, forces, or quantum selection rules
The term "selection rule" is used in the dynamical sense — an empirically observed restriction on which persistent configurations can form — not in the quantum-mechanical sense of a symmetry-derived exact prohibition.
The geometry does not just permit structure — it selects which structures are allowed.